
When it comes on terms of meta ads reporting the first tool that comes to your mind is the solution provided by Meta, the meta ads reporting tool that is an excellent feature of the Meta Business Manager account. This solution has capabilities that go far beyond the Ads Manager dashboard, making it ideal for sharing important data with your clients or even within your organisation.
Let’s Dive in Step by Step.
Step 1: Access your Ads manager Account
Step 2: Access Ads Reporting Tab
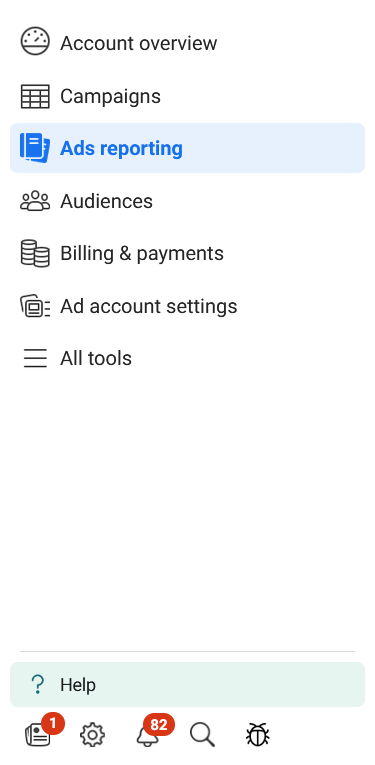
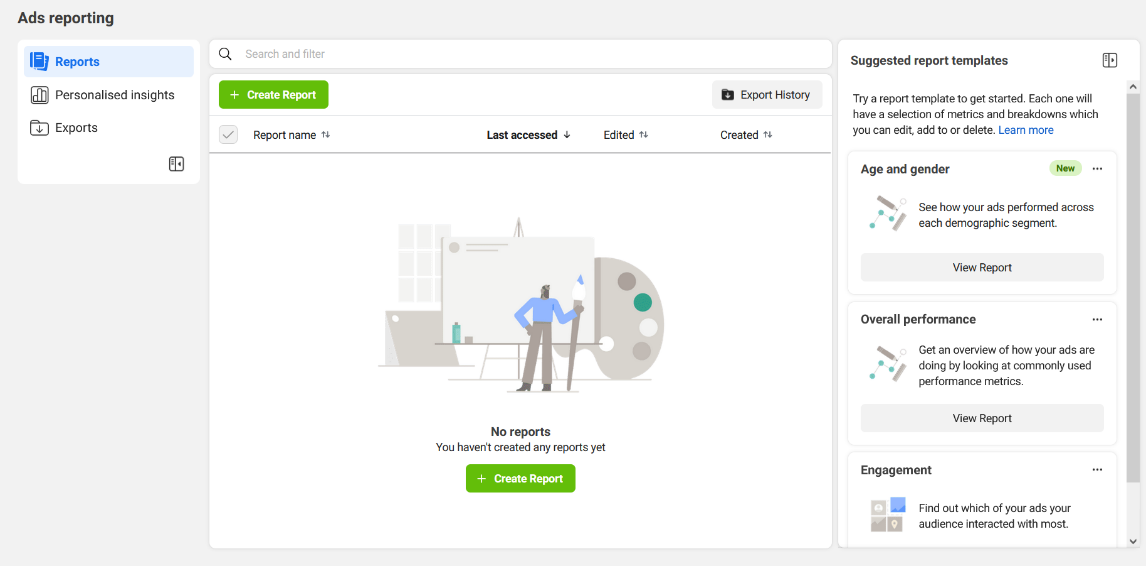
From the menu on the left, select the Ads Reporting button. This will bring up a three button menu in the top left corner that says Reports, Personal Insights, Exports. On the Reports tab, press the Create Report green button.
Step 3: Provide a Name for your Meta Ads reports
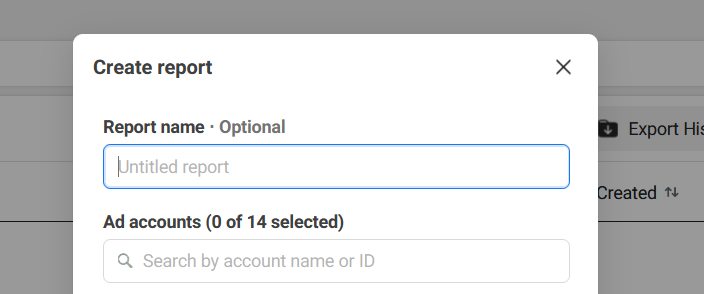
Step 4: Select one or more Ad Accounts to include in your Meta Ads reports.
Step 5: Then select a layout from a radio button list.
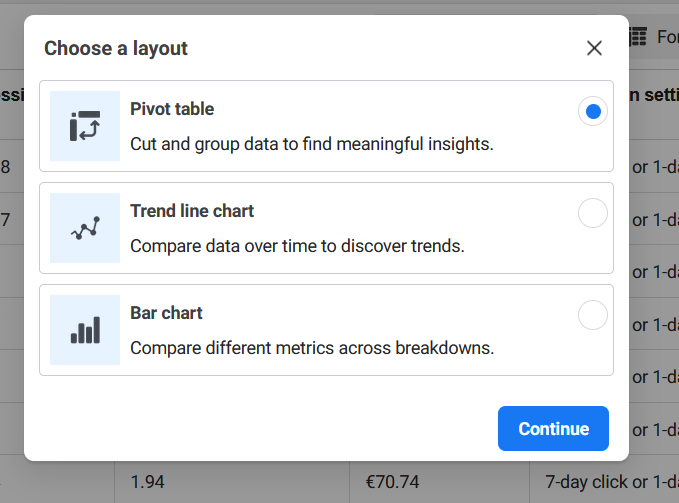
Let's analyse the layout Meta provides for your meta ad reporting efforts.
Pivot table: As mentioned in IBM, a pivot table is a powerful data summarisation tool that can automatically sort, count and summarise data stored in tables and display the summarised data.
Trend line chart: As seen on facebook, trend lines help you see and compare metrics over time to understand trends.
Bar chart: This visualisation helps you compare metric values or the distribution of data points across your data sets.
Step 6: In the right-hand menu, you can customise the layout you have selected.
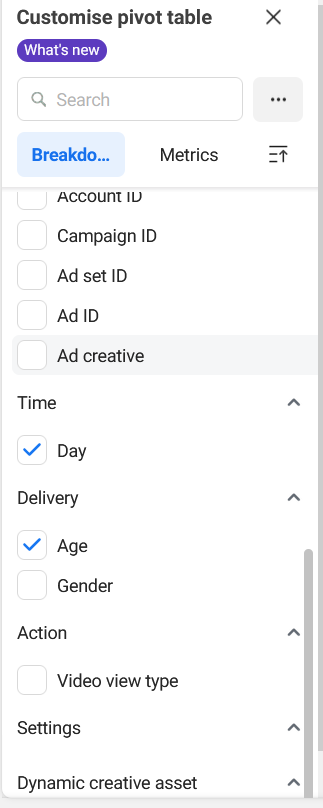
Let's say you've selected the Pivot Table, in the right-hand menu you can choose from popular breakdowns such as Campaign Name, Ad Set Name, Ad Name, Page Name, Ad Creative, Age, Gender, Country, Region, Platform, Placement, Objective, Day, Month, or you can create a custom breakdown.
What are custom breakdowns?
Custom breakdowns let you cut your data in ways that go beyond the standard breakdowns. You can group campaigns, ad sets and ads to compare segments and gain insights about your performance.
How can I use custom breakdowns in my analysis?
You can create breakdown segments based on things such as campaign name or objective, similar to how you might use filters to zoom in on data in a table. These breakdown segments will then appear as rows in your table, allowing you to analyse these new segments.
For example, if you want to analyse your marketing objectives, you can build breakdown segments around awareness, consideration and conversion.
The ideal Custom Breakdown is to create a segment based on the target stages of your marketing funnel. Select Awareness or Reach as the goal for the first break segment, then select Traffic or Engagement as the goal for the second break segment, and then select Conversions as the goal for the third break segment.
From the right-hand menu you can select the level of data you want to display in your pivot table. Do you want to show: Campaign Name, Ad Set Name, Ad Name, Page Name, Campaign ID, Ad Set ID, Ad ID, Page I, Ad Creative
If you are using a pivot table, try selecting the timeframe you want to break your data into and the age group
Explanation of filters you can choose to customize your meta ads reporting.
A filter called “Had delivered” is automatically applied and it cannot be removed. The other filters you can select are :
Name/ ID – Filter by the names or IDs of campaigns, ad sets, or ads.
Delivery – Filter by delivery status for campaigns, ad sets, or ads, such as active, inactive, scheduled, completed, not approved, or deleted.
Objective – Filter by objective, such as awareness, brand awareness, catalog sales, conversions, desktop app engagement, desktop app installs, engagement, event responses, lead generation, leads, messages, mobile app engagement, mobile app installs, offer claims, page likes, post engagement, reach, sales, store traffic, traffic, or video views. (You can choose several.)
Audience – Filter by custom audience
Finally, when your meta ads reporting is ready and set you are ready to export it or share it.
What sharing options are available on Meta Ads reporting?
There are three general ways your report can be shared.
Firstly you can copy and share a link. Secondly you can export to a file and last option is scheduling an email. Above is the description of each of those options and the sub-options they offer:
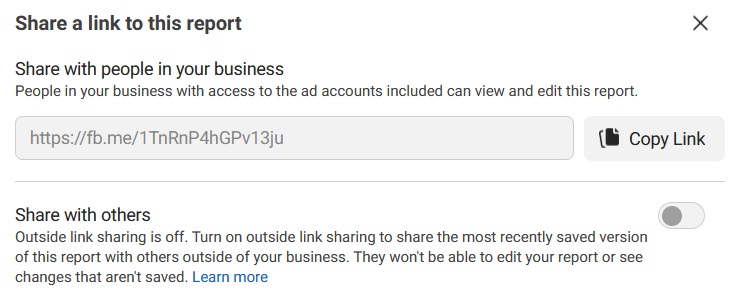
Sharing a link : When you click on the Share button, a box will open providing a shareable URL to view the report. In order to access the information provided by the link, you must have access to the ad account. However, there is an option to share a link with others who don't have access, which can be toggled on. To use this feature, you will need to set an expiration date for the link. The link will only be active for a maximum of one month.
Exporting to a file – Clicking the Export button allows you to choose a name for the exported file and a file format. The choices are Formatted data table (.xlsx), Raw data table (.xlsx), CSV (.csv), and Image (.png). There’s also a checkbox for including a summary row if you want one included.